Using test automation to help me test, a Google Elevation API example
Someone once asked me if “Testing a login-process was a good thing to ‘automate’?”. We discussed the actual testing and checking they were concerned with. Their real concern was that their product’s ‘login’ feature was a fundamental requirement, if that was ‘broken’ they wanted the team to know quick and to get it fixed quicker. A failure to login was probably going to be a show-stopping defect in the product. Another hope was that they could ‘liberate’ the testers from testing this functionality laboriously in every build/release etc.
At this point the context becomes relevant, the answers can change depending the team, company and application involved. We have an idea of what the team are thinking - we need to think about why they have those ideas. For example, do we host or own the login/authentication service? if not, how much value is their in testing the actual login-process? Would a mock of that service suffice for our automated checks?
What are we looking for in our automated checks? To see it work? for one user? one user at a time? one type of user at a time? I assume we need to check the inverse of these as well, i.e.: Does it not accept a login for an unacceptable user? otherwise we could easily miss one of the most important tests - do we actually allow and disallow user-logins as required/correctly?
These questions soon start highlight the point at which automation can help, and complement testing. That is to say test automation probably wouldn’t be a good idea for testing a user-login. But would probably be a good ideas for testing 100 or 1000 logins or types of login. Your testers will probably have to login to use the system themselves, so will inevitably use and eyeball the login process from a a single user perspective. They will unlikely have the time, or patience to test a matrix of 1000 user logins and permissions. Furthermore, the login-service could take advantage of the features automation can bring. For example the login service could be accessed directly and the login API called in what ever manner the tester desires (sequential, parallel, duplicates, fast, slow, random etc). These tests could not practically be performed by one person, and yet are likely to be realistic usage scenarios.
An investigation using reasoning and test automation such as this, that plays to the computers strengths can have the desired knock-on effect of liberating the tester, can even provide them with intelligence [information] to aid finding out more information or bugs. The questioning about what they want, what they need, what are they working-with, all sprang from their desire to find out about a specific application of test automation.
For example, I recently practiced some exploratory test automation on the Google Maps API, in particular the Elevation API. The service, in exchange for a latitude and longitude values returns an elevation in meters. The API is designed for use in conjunction with the other Google Maps APIs, but can be used directly without login, via a simple URL. If we had to test this system, maybe as a potential customer or if I was working with the developers, how might we do that? How might test automation help?
I start by skim-reading the documentation page, just as much as I need to get started. Firstly, as a tester I can immediately bring some issues to light. I can see the page does not provide an obvious indication of what it means by ‘elevation’. Is that elevation above sea level? If so does it refer to height above Mean High Water Spring, as is typical for things such as bridges over the sea or river estuaries. Or is it referring to the height above ‘chart datum’ a somewhat contrived estimate of a mean low tide. I make a note, These questions might well be important to our team - but not instantly answerable.
There’s more information on nautical charts.
The documentation also doesn’t readily indicate what survey the data is based on (WGS84, OSGB36 etc ) While this won’t cause you much concern for plotting the location and elevation of your local pizza delivery guy. It might cause concern if you are using the system for anything business critical. For example the two systems mentioned; WGS84 and OSGB36 can map the same co-ordinates to locations 70 metres apart. Again, context questions are arising. Who’d use this system? If you are hill walking in England or Scotland, the latter is likely to be the system used by your Ordinance Survey maps. But your handheld GPS system is likely to default to the American GPS convention of WGS84. Again, important questions for our team, what will the information be used with? by whom? Will it be meaningful and accurate when used with other data?
Starting to use the API, as with most software is one of the best ways to find out how it does and does not work. I could easily check to see if a single request will deliver a response, with a command like this, e.g:
curl -s ‘http://maps.googleapis.com/maps/api/elevation/json?locations=10,1&sensor=false’
I tried a few points, checking the sorts of responses I receive. The responses are JSON by default, indented for readability and the precision of co-ordinates and elevation is to several data decimal points. There again, more questions… Does it need to be human readable? Should we save on bandwidth by leaving out the whitespace? Should the elevation be to 14 decimal point? Here is an example response:
{
“results” : [
{
“elevation” : 39.87668991088867,
“location” : {
“lat” : 50.67643799459280,
“lng” : -1.235103116128651
},
“resolution” : 610.8129272460938
}
],
“status” : “OK”
}
Were the responses typical? To get a bigger sample of data, I decided to request a series of points, across a large area. I chose the Isle of Wight, an area to the south of England that includes areas above & below sea level and is well charted. If I see any strange results I should be able to get a reference map to compare the data against reasonably easily. I also chose to request the points at random rather than request them sequentially. This would allow me to get an overall impression of the elevations with a smaller sample. It would also help to mitigate any bias I might have in choosing latitude or longitude values. I used Ruby’s built-in Rand method to generate the numbers. While not truly random, or as random as those found at random.org, they are likely to be considerably more random than those I might choose myself.
I quickly wrote a simple unix shell script to request single elevation points, for a pair of co-ordinates. The points would be chosen at random within the bounds decided (the Isle of man and surrounds). The script would continue requesting continuously, pausing slightly in between each request to avoid overloading the server and being blocked. The results are each directed to a numbered file. A simple script like this can be quickly written in shell, ruby or similar and left to work in our absence. Its simplicity means maintenance and upfront costs are kept to a minimum. No days or weeks of ‘test framework’ development or reworking. My script was less than a dozen lines long and was written in minutes.
Left to run in the background, while I focused on other work, the script silently did the mundane work we are not good at, but computers excel at. Using the results of these API requests I hoped to chart the results, and maybe spot some anomalies or erroneous data. I thought they might be easier to ‘notice’ if presented in graphical form.
Several hours later, I examined the results. This is where unix-commands become particularly useful, I can easily ‘grep’ every file (in a folder now full of several thousand responses) for any lines of text that contain a given string. I looked at the last few responses from the elevation API, and notice that the server has stopped serving results as I have exceeded the query limit. That is, I have requested more elevation values than are allowed under the services terms-of-service. Thats useful information, I can check whether the server started doing this after the right period of time - and how it calculates that. I now have more questions and even some actual real-data I can re-analyse to help.
Often test automation ignores most of the useful information, and is reduced to a simple Pass/Fail check on one or a handful of pre-defined checks. But if you keep all the data, you can re-process the data at any time. I tend to dump it all to individual files, log files or a even a database. Then you can often re-start analysing the system using the recorded data very quickly, and test your ideas against the real system.
In our Google Elevation API example, Using grep, I quickly scanned every file to see all results that were accepted. The command looked like this:
grep “status” * | grep -v OVER_QUERY_LIMIT
In half a second the command has searched through over 12 thousand results and presented me with the name of the file and the actual lines that include the ‘status’ response line. A quick scroll through the results and blink test - highlights that their is in fact another type of result. As well as those that exceeded the query limit, those that were ok, there is a third group that return an UNKNOWN_ERROR. Another quick scan of the documentation shows that this is one of the expected response status for the API. I quickly retry the few responses that failed using the same latitude and longitude values - they worked and returned seemingly valid data. This suggests that these failures were intermittent. The failures indicated a useful point; The system can fail, and unpredictably.
More questions… How reliable is the system? Is it reliable enough for my client?
A quick calculation, based on the the number of requests and failures showed that although I had only seen few failures, that was enough to take the availability of the service from 100% down to just under 99.98% reliability. Thats often considered good, but if for example my client was paying for 4 nines (99.99%), They’d want to know. If only to give them a useful negotiation point in contract renewals. I re-ran this test and analysis later and saw a very similar result, it appears as if this might be a useful estimation of the service’s availability.
Using the data I had collected, I wrote a short ruby script that read the JSON responses and outputted a single CSV file containing the latitude, longitude and elevation. Ruby is my preference over shell for this type of task, as it has built-in libraries that make the interpretation of data in XML, JSON and YAML form, almost trivial. I then fed these results in to GNUPlot, a simple and free chart plotting tool. GNUPlot allowed me to easily change the colour of plotted points depending on whether the elevation was positive or negative.
Here’s the result:
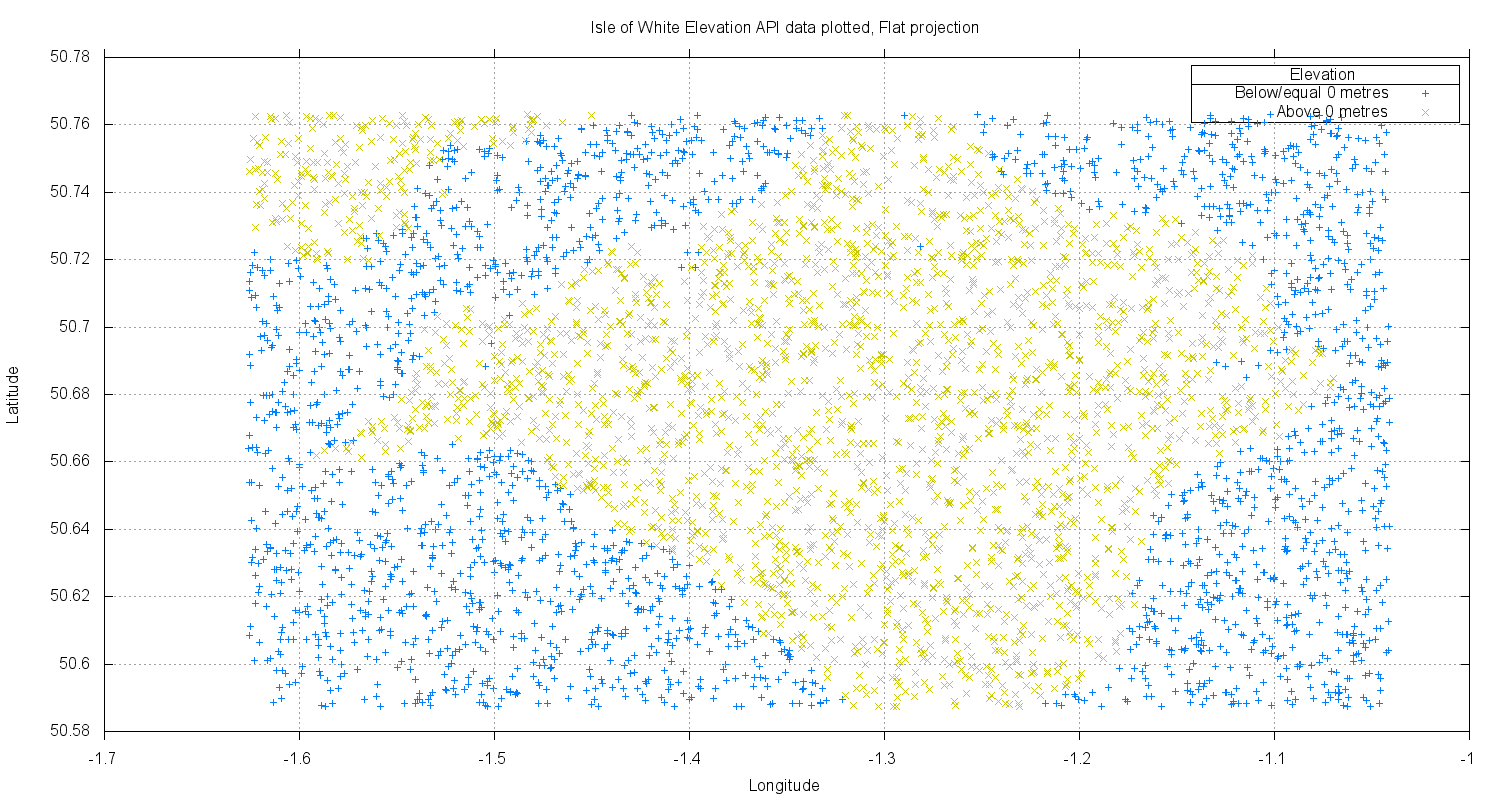
You can see the outline of the Isle, and even what I suspected were a couple of erroneous data points. Closer examination suggests that these are in fact likely to be correct, as they correspond to channels and bays that are open to the sea. Although this exercise had yet to highlight any issues - it performed as useful function nonetheless. It had let me compare my results against another map visually, checking that I was grabbing and plotting the data at least superficially correctly. I had not for example confused latitude with longitude.
I did notice one thing that was not expected in the resulting map. The cloud of points seemed to lack any obvious distortion compared with other maps I found online. It seemed, too good, especially as I had ignored all I had not used any correction for the map projection. I had taken the 3 dimensional lat and long values and ‘flat’ projected them - and the result still looked ok.
This illustrates how testing is not so much about finding bugs - but rather about finding information, asking questions. We then use that information to help find more information through more testing. I now suspected the data was set to use a projection that worked well at European latitudes e.g. Mercator, or used some other system to make things look ‘right’ to me. How might this manifest it self elsewhere in the APIs responses? (Google documentation has more info on projections used etc.)
Thinking back to the 3 dimensional nature of the data, I knew that a point on the globe can be represented by multiple sets of co-ordinates [if we use Latitude & Longitude]. A good example is the North Pole. This has a latitude of 90 degrees, but can have any valid longitude.. I try various co-ordinates for the North Pole, and each returned a different elevation. Thats interesting, my client might be planning to using the system for fairly northern latitudes - will the data be accurate enough? If elevation is unreliable around the pole, at what latitude will it be ‘good enough’? If our product owners want more information about just how variable the elevation is at the pole is? Or what is the elevation at the south pole? Those are pretty simple modifications to my short script. (Wikipedia has some interesting comments about Google maps near the poles.)
The simple automation used in this example, combined with a human interpretation used relatively little expensive ‘human’ time and yet maximised the return of automation. Many ‘automation solutions’ are quite the reverse; requiring extensive development, maintenance and baby sitting. They typically require specialised environments, machine-estates to be created and maintained by [expensive] people. This is far from actually being automated, the man hours required to keep them running, to interpret the results and rerun the ambiguous failures is often substantial.
The exploratory investigation outlined here greatly improves on the coverage a lone human tester can achieve, and yet is lightweight and simple. The scripts are short and easily understood by testers new to the team. They are written in commonly used languages and can be understood quickly by programmers and system administrators alike. My client won’t be locked into using “the only guy that can keep those tests running!” and they can free their staff to work on the product - the product that makes money.